Circularity metric
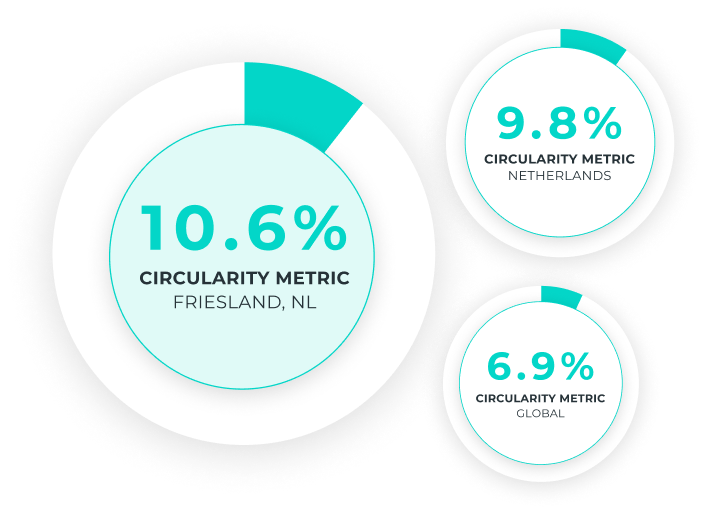
The Circularity Metric represents the share of secondary materials consumed in the region, relative to the total consumption of materials (virgin & secondary). Friesland’s Circularity Metric is 10.6%, meaning that 10.6% of the region’s material consumption comes from secondary materials that have been recovered and reintegrated into the Frisian economy. This is higher than the Dutch national Circularity Metric for the same year, which stands at 9.8%[1].
Among Friesland’s secondary material inputs, the largest share— 93% (1.3 Mt)—comes from recycled waste, primarily processed through breaking, a method primarily used to prepare construction and demolition waste for reuse as aggregates in circular construction. Additionally, 6% (79 kt) of secondary materials are directly repurposed in construction without extensive processing, preserving their original form and function. Finally, 2% (30 kt) come from indirect high-quality reuse (where some form of treatment is required before reuse).
Improving the circularity metric
Friesland is home to a wide range of initiatives that are already helping to improve its Circularity Metric—by both reducing overall material consumption and increasing the share of secondary materials in use.
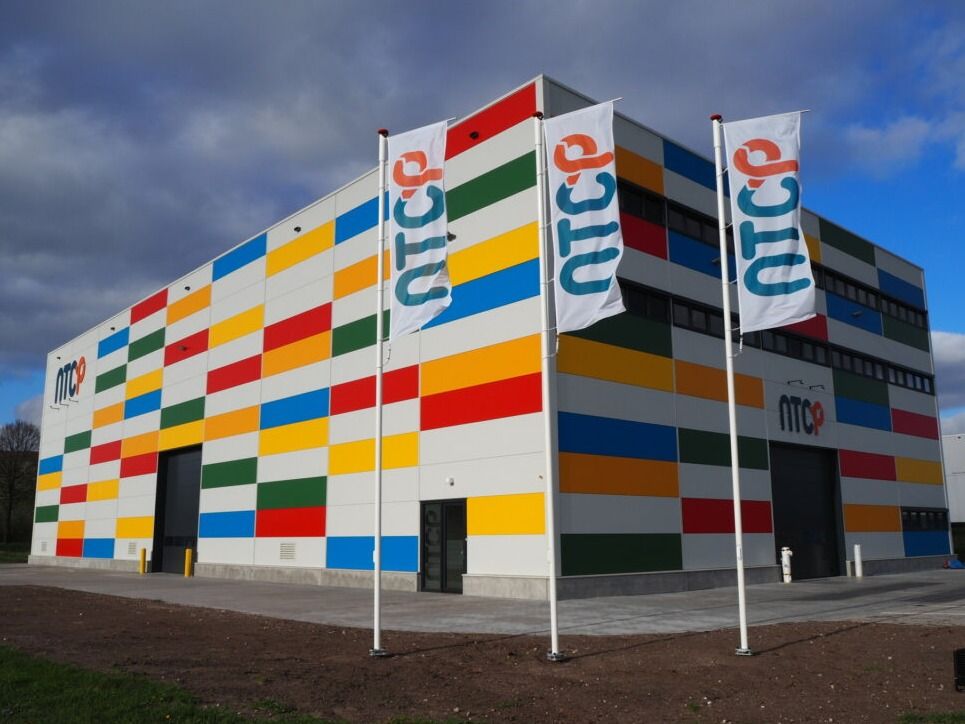
NTCP: Pioneering Circular Plastics in Friesland
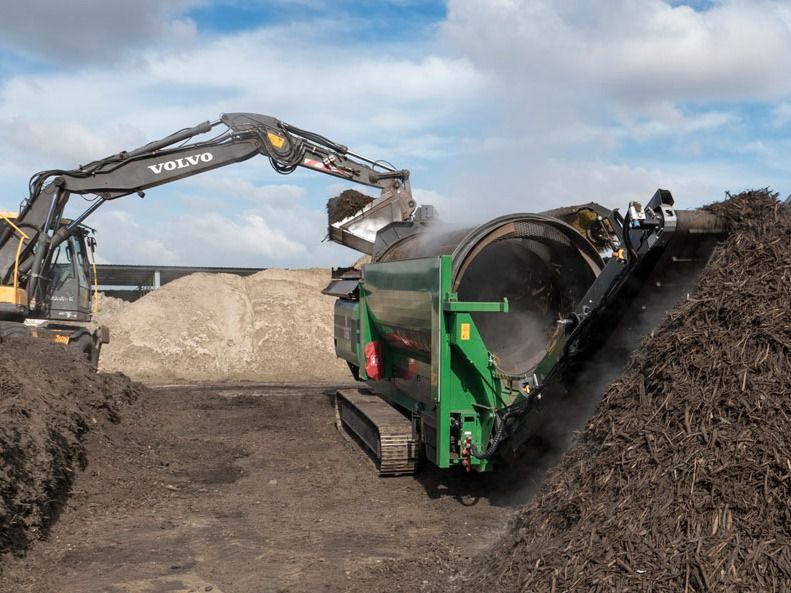
Grondbank Leeuwarden: A Circular Approach to Soil Reuse
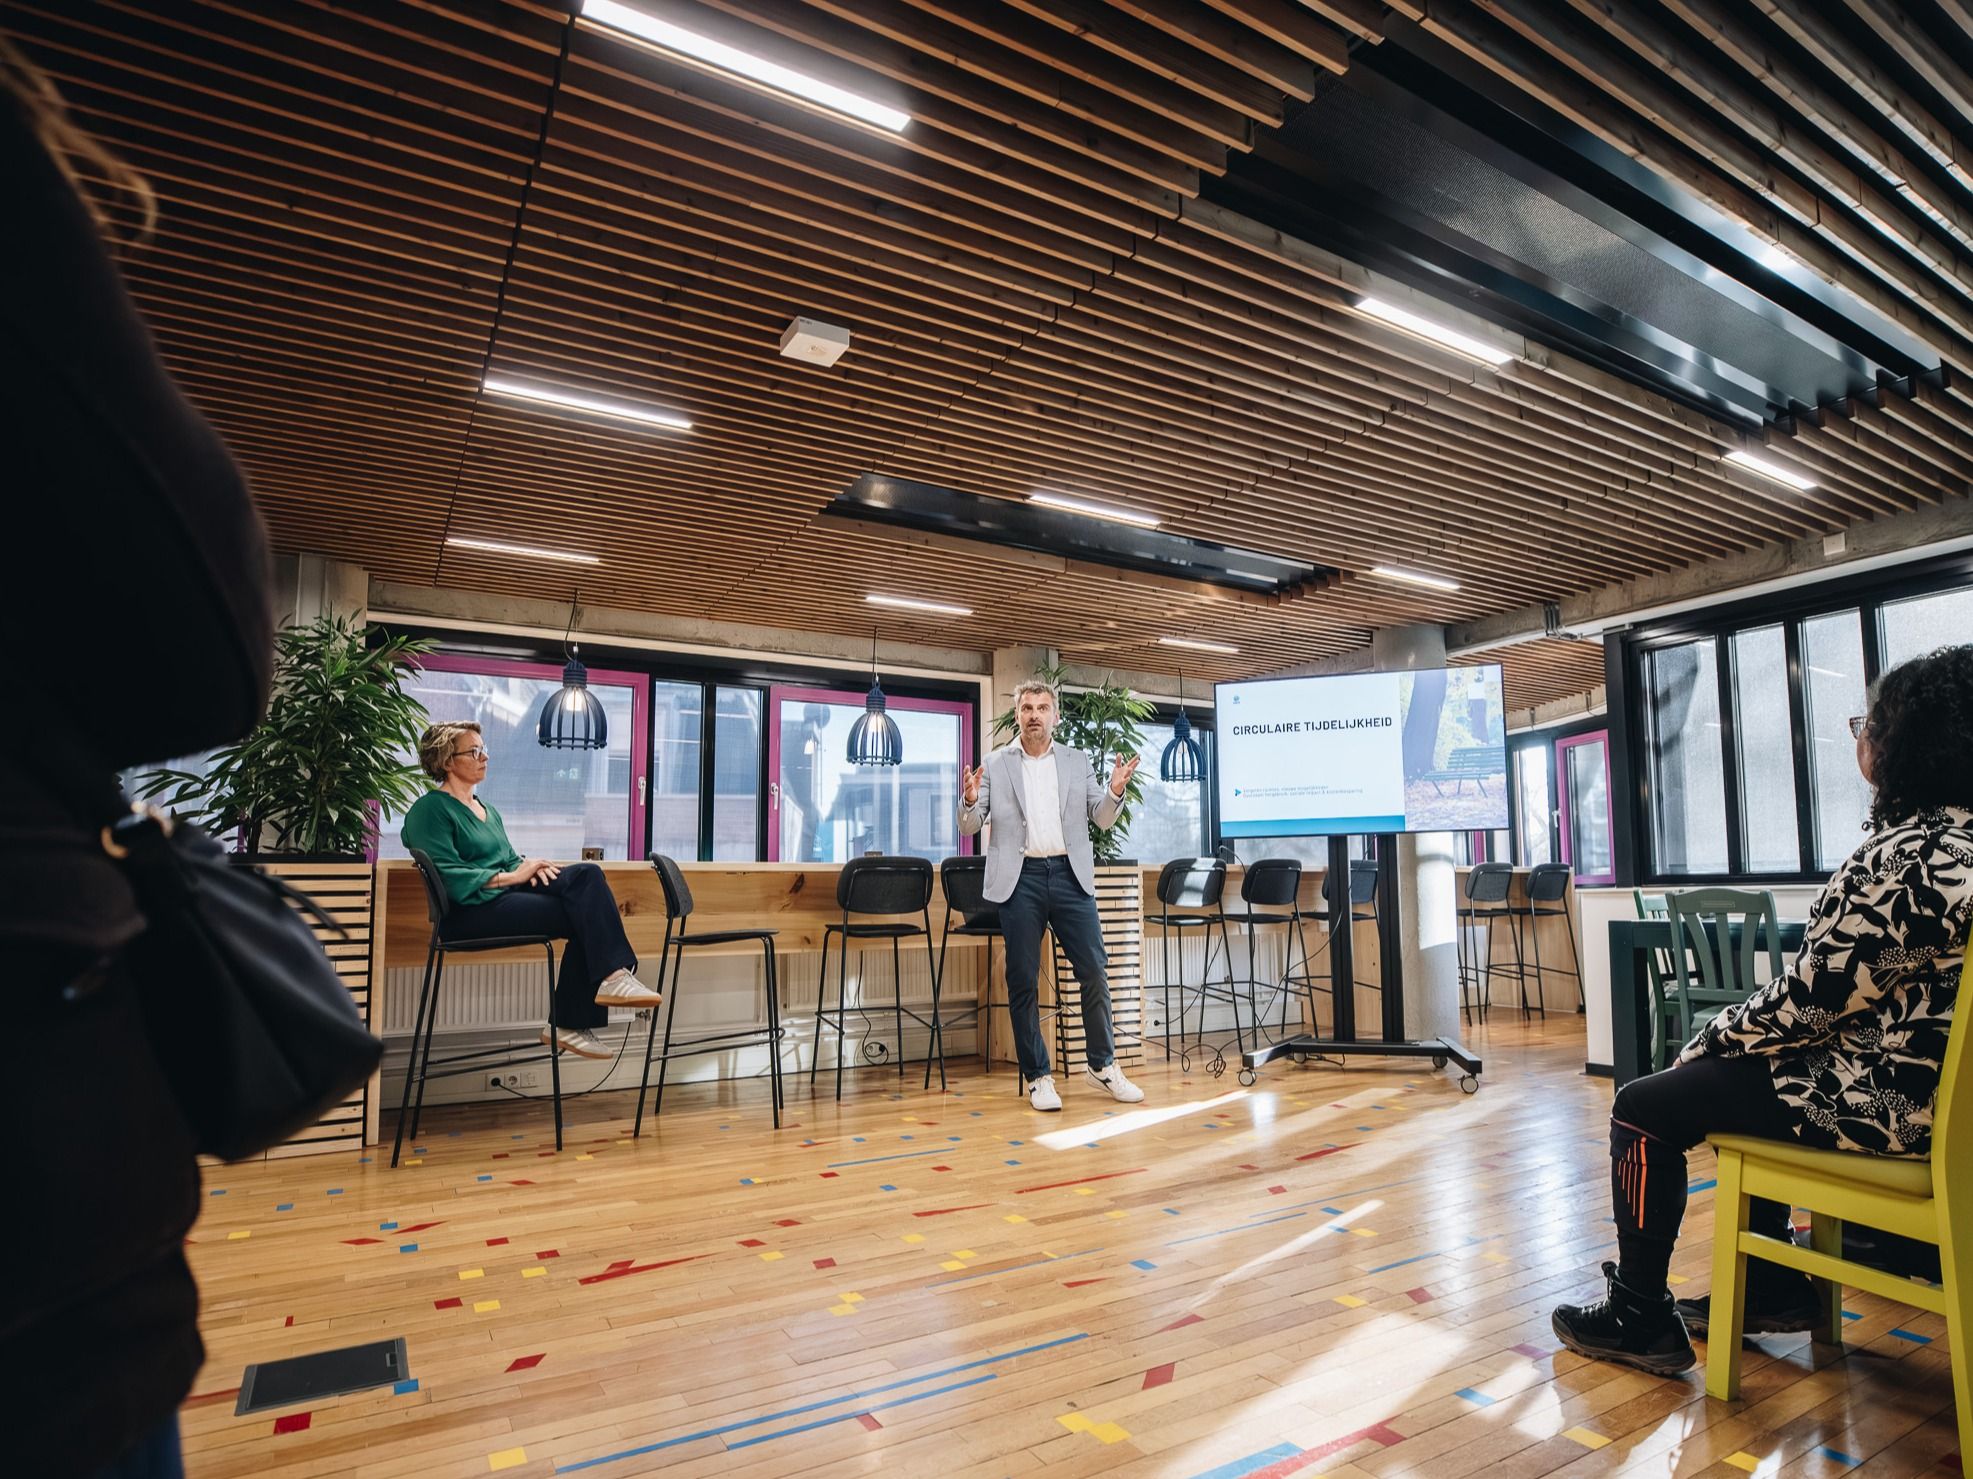
Circular Renovation of Carré 1: Leading by Example
Urban Mining: Refurbished sanitary facilities
To strengthen this impact, the region can focus on measures, such as:
- Measures that reduce the material footprint, as mentioned in this section.
- Stimulating the demand for secondary materials through public procurement initiatives.
- Managing waste locally and through impacts to ensure sufficient availability of secondary materials.
- Prioritising high-value reuse over downcycling.
Circle Economy continuously improves the methodologies, data sources, and quality assurances of our CGRs, and as such results may vary. The methodology used to calculate the technical cycling of the economy differs between the old approach outlined in the CGR Netherlands 2019 report and the methods applied in this analysis. While both approaches share a similar foundation, certain methodological choices have a significant impact on the results.
One key difference is the selection of the Multi-Regional Input-Output (MRIO) database, which can substantially affect the calculation of Raw Material Consumption (RMC). In the previous analysis, Exiobase was used, whereas this study relies on the FIGARO MRIO database. Because this study is subnational, we used a NUTS2 MRIO based on FIGARO to downscale the latest economic data. Additionally, the year of analysis of the previous Dutch assessment was based on 2016 data, while the current analysis is based on 2023 data. Additionally, all material extraction figures have been updated in the environmental extension to use a more globally aligned data source.
Beyond database selection, the inclusion of certain recycled and recovered waste streams as secondary materials also plays a crucial role. In the previous methodology, the reported waste included soils and dredging spoils. However, in this analysis, these materials are excluded, as they are considered waste from unused extraction and therefore not part of RMC calculations. Additionally, other biological waste flows—such as agricultural waste, food waste, and common sludges—are also excluded from the recycled content. These materials are included in the ecological cycling potential instead, and are as such not included in the technical cycling rate.