Waste treatment breakdown
The waste treatment breakdown illustrates how waste in the region is processed, encompassing methods such as recycling, landfilling, and incineration. It also accounts for imported waste, providing a comprehensive view of how waste is handled within the region. This breakdown highlights the percentage of waste processed through each method, offering valuable insights into the region’s waste management practices and their environmental impact.
This analysis identifies three primary categories of waste treatment: recycling, recovery, and other. Each of these categories can be further subdivided into more specific processes to give a detailed understanding of waste management practices. Recycling includes preparation for recycling, direct high-quality reuse (where no processing is necessary), and indirect high-quality reuse (where some form of treatment is required before reuse). Recovered waste encompasses microbiological processing, including biological treatments such as composting, anaerobic digestion, and fermentation, as well as incineration with energy recovery. The “other” category refers to landfilling, incineration, and temporary storage before treatment or final disposal.
The total waste generation in Friesland amounts to 3.1 Mt. The largest waste treatment category in Friesland is recycling, with a recycling rate of 46%, amounting to 1.4 Mt. Of this total, the majority—1.3 Mt—is prepared for further recycling. Only 4% of the total waste 0.1 Mt) consists of high-quality materials that are either directly reused or treated and then reused. This breakdown shows that recycling is the dominant waste treatment method in Friesland, accounting for nearly half of the total waste. However, the fact that only 4% of the total waste is reused as high-quality materials highlights a discrepancy between materials prepared for recycling and those directly reintegrated into the economy.
The next largest waste stream is categorized as ‘other waste flows,’ with the majority (29%) temporarily stored or set aside for later treatment. Of the total waste, only 1% is sent to landfill, and 3% (0.1 Mt) is incinerated. This demonstrates that minimal amounts of waste are sent to landfill and incineration, with Friesland’s rates being far lower than the EU average of 30% for landfilling and 7% for incineration[2].
Recovered waste accounts for 13% (410 Gt), with the majority processed through microbiological treatments such as composting and anaerobic digestion. Another 8% (245 Gt) is recovered through waste-to-energy processes[3]. Omrin’s waste separation rate stands at an impressive 78%, placing it among Europe’s top performers. A key factor behind this success is the separation and digestion of organic waste fractions (OWF), which distinguishes Omrin from other waste management systems.

Omrin: Showcasing the Frisian approach to Circular Economy
Omrin champions Friesland’s circular economy through a collaborative, trust-based approach. Starting as a regional waste management company, it has grown into a key player by connecting municipalities, businesses, and knowledge institutions. Circularity is woven into every aspect of Omrin’s operations, from waste recovery to creating local value. With a governance model that prioritizes shared responsibility and continuous learning, Omrin exemplifies Friesland’s bottom-up, partnership-driven transition to a sustainable future.
Read moreImproving waste treatment
Friesland is home to many initiatives that already contribute to improving its waste management system.
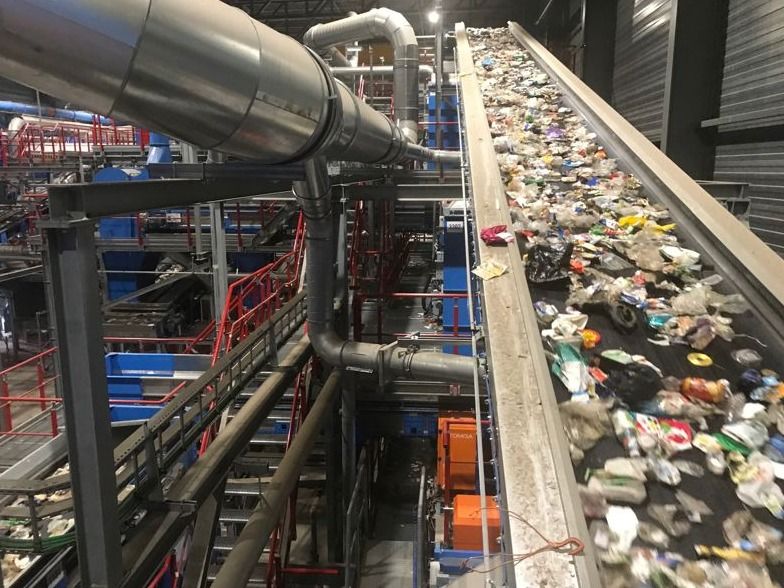
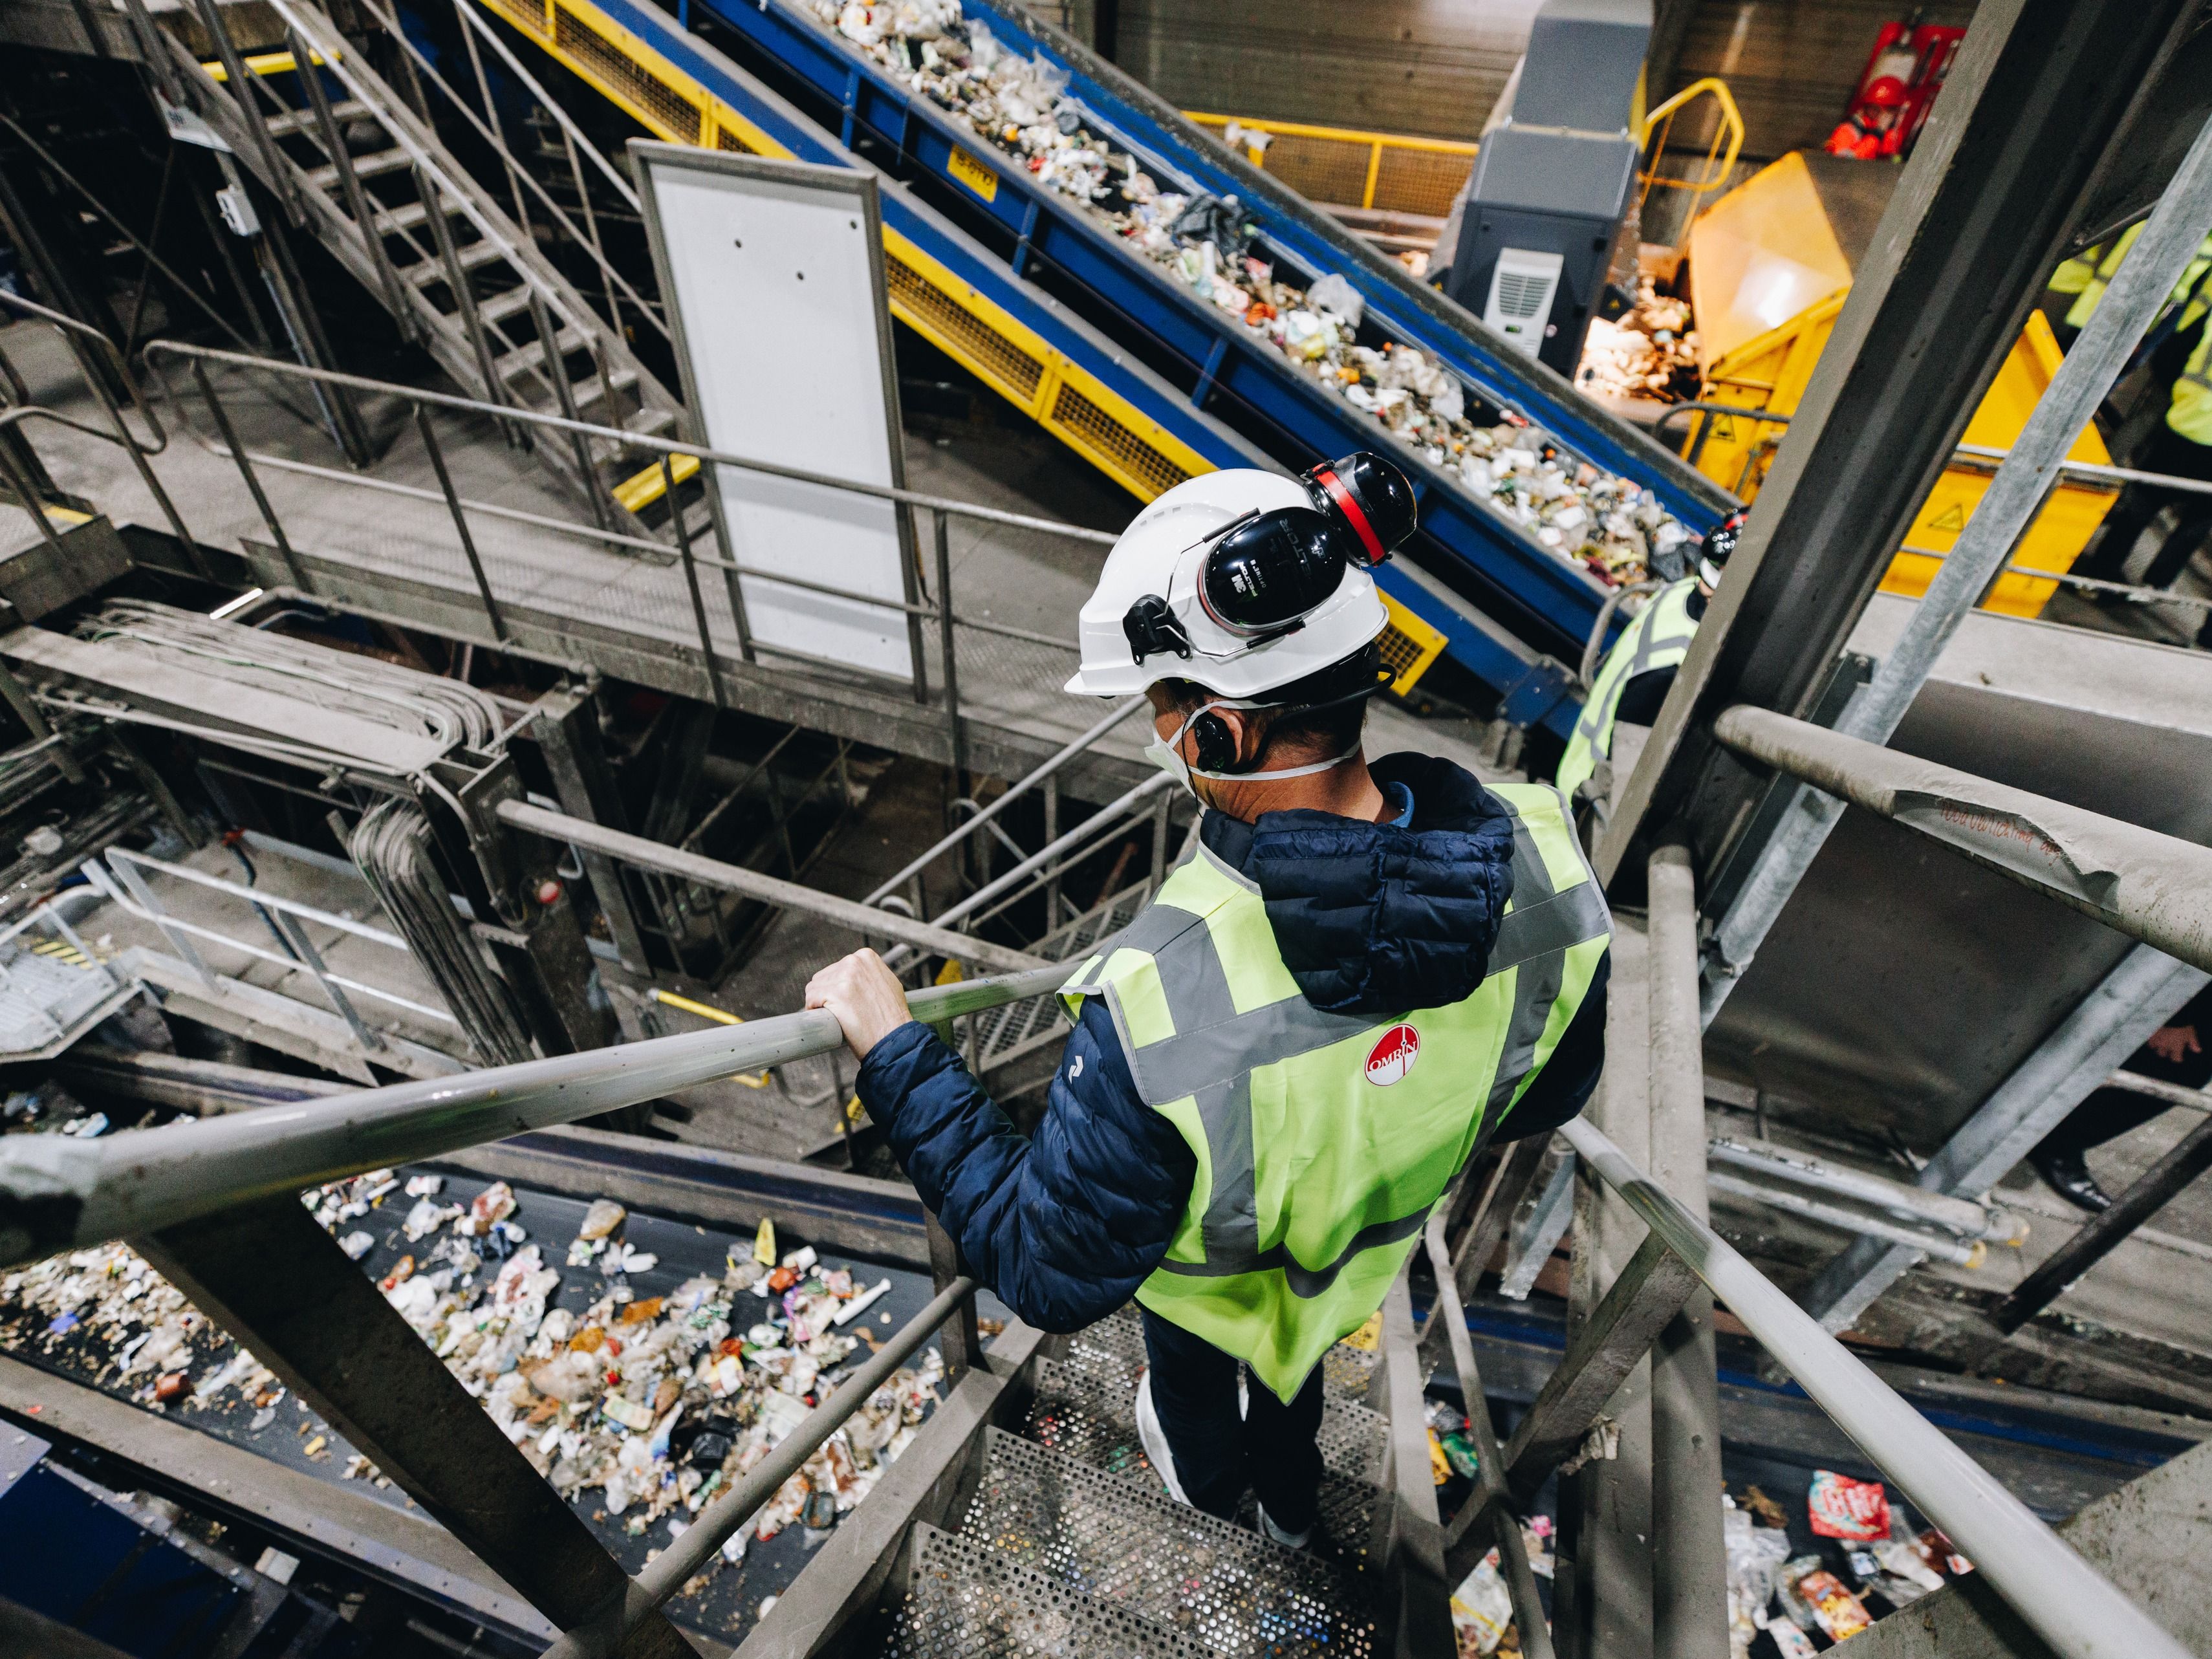
Advancing Circular Waste Management: Omrin’s Innovative Recycling Technologies
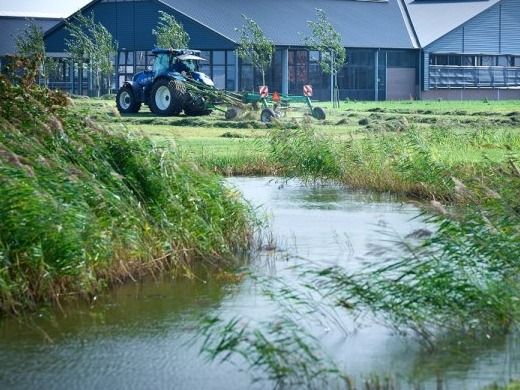
SNUK: Closing Nutrient Loops in Friesland
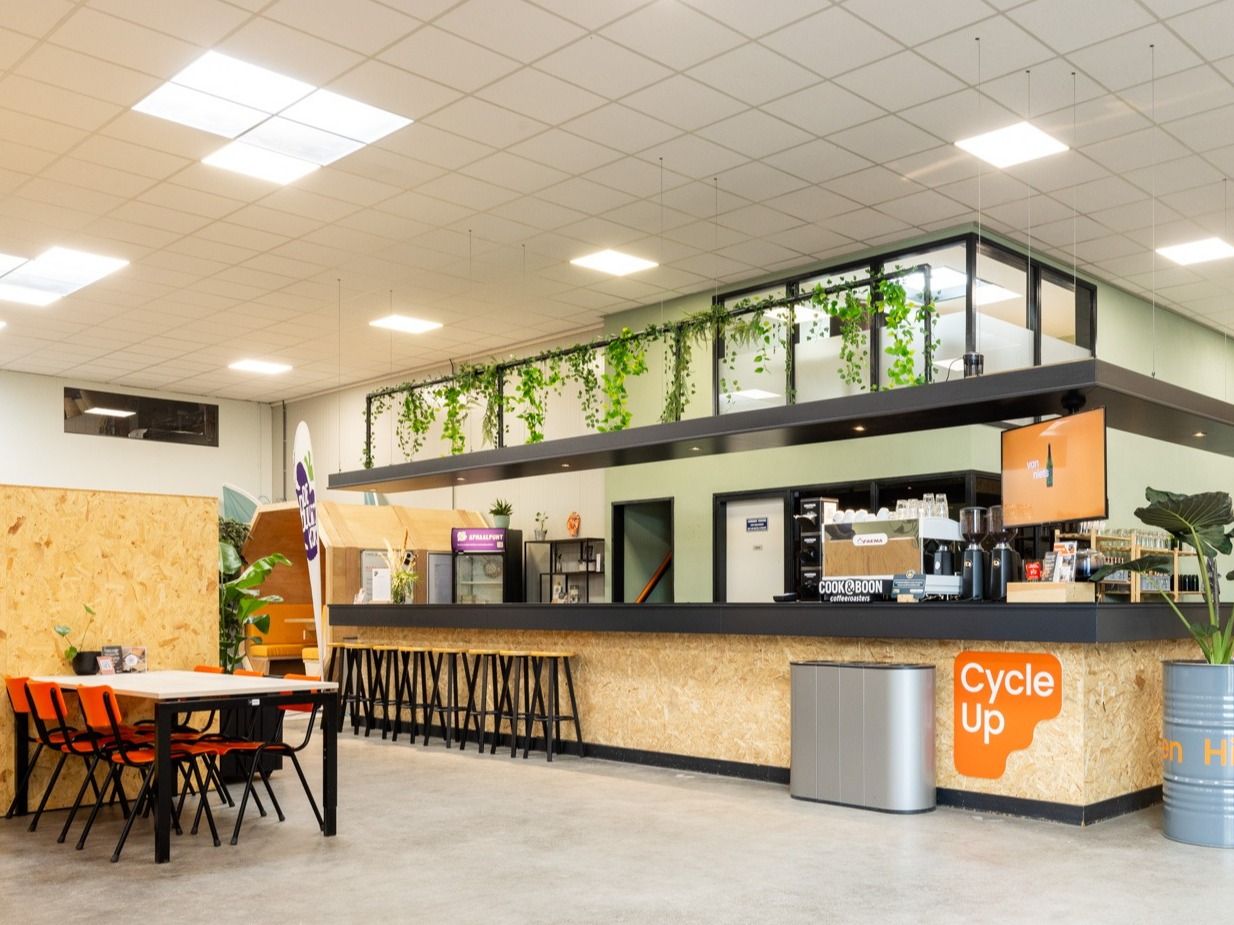
Cycle Up Hub: Circular service hub for startups
To strengthen this impact, the region can focus on measures, such as:
- Reducing overall waste generation through smarter design, local reuse centres, and awareness campaigns that encourage responsible consumption.
- Importing and designing products that allow for easier reuse and recycling, by favouring materials and formats that support disassembly, durability, and end-of-life processing.
- Prioritising businesses and initiatives that support higher R-strategies like reuse, repair, and refurbishment—before recycling.
Statistics Netherlands (CBS). (2024). Gemeentelijke afvalstoffen; hoeveelheden. Retrieved from: CBS statline website
Eurostat. (2024). Waste statistics. Retrieved from: Eurostat website
Data is sourced from an unpublished study by the National Monitor Programme of the Cooperative Provinces (IPO)