Material flows and footprints
Using socioeconomic metabolism, we track material and energy flows within Friesland’s economy, which operates like a living system. The Sankey diagram illustrates how virgin and secondary materials are extracted, imported, processed, and consumed across ‘sectors of final demand.’ It highlights the distribution of raw material consumption across seven sectors, each representing a societal need: Housing and Infrastructure, Services, Mobility, Nutrition, Manufactured Goods, Healthcare and Education, and Communication. This breakdown offers a clear view of how resources flow to meet societal demands.
A previous material flow analysis was conducted by Metabolic and Urgenda in 2015. However, the analysis had a different scope, focusing primarily on agriculture, energy, and water. Due to differing sector aggregation and methodological choices—such as the inclusion of water—direct comparison is not possible. Our approach covers the entire economy across seven societal needs and represents all flows in weight terms, explicitly excluding water to avoid distortion [1].
Friesland, as a relatively small but economically active region, relies heavily on trade, making its economy both import-dependent and resource-intensive. While Friesland engages in domestic resource extraction, particularly in the agrifood sector, much of this output is ultimately exported, contributing to other region’s footprint.
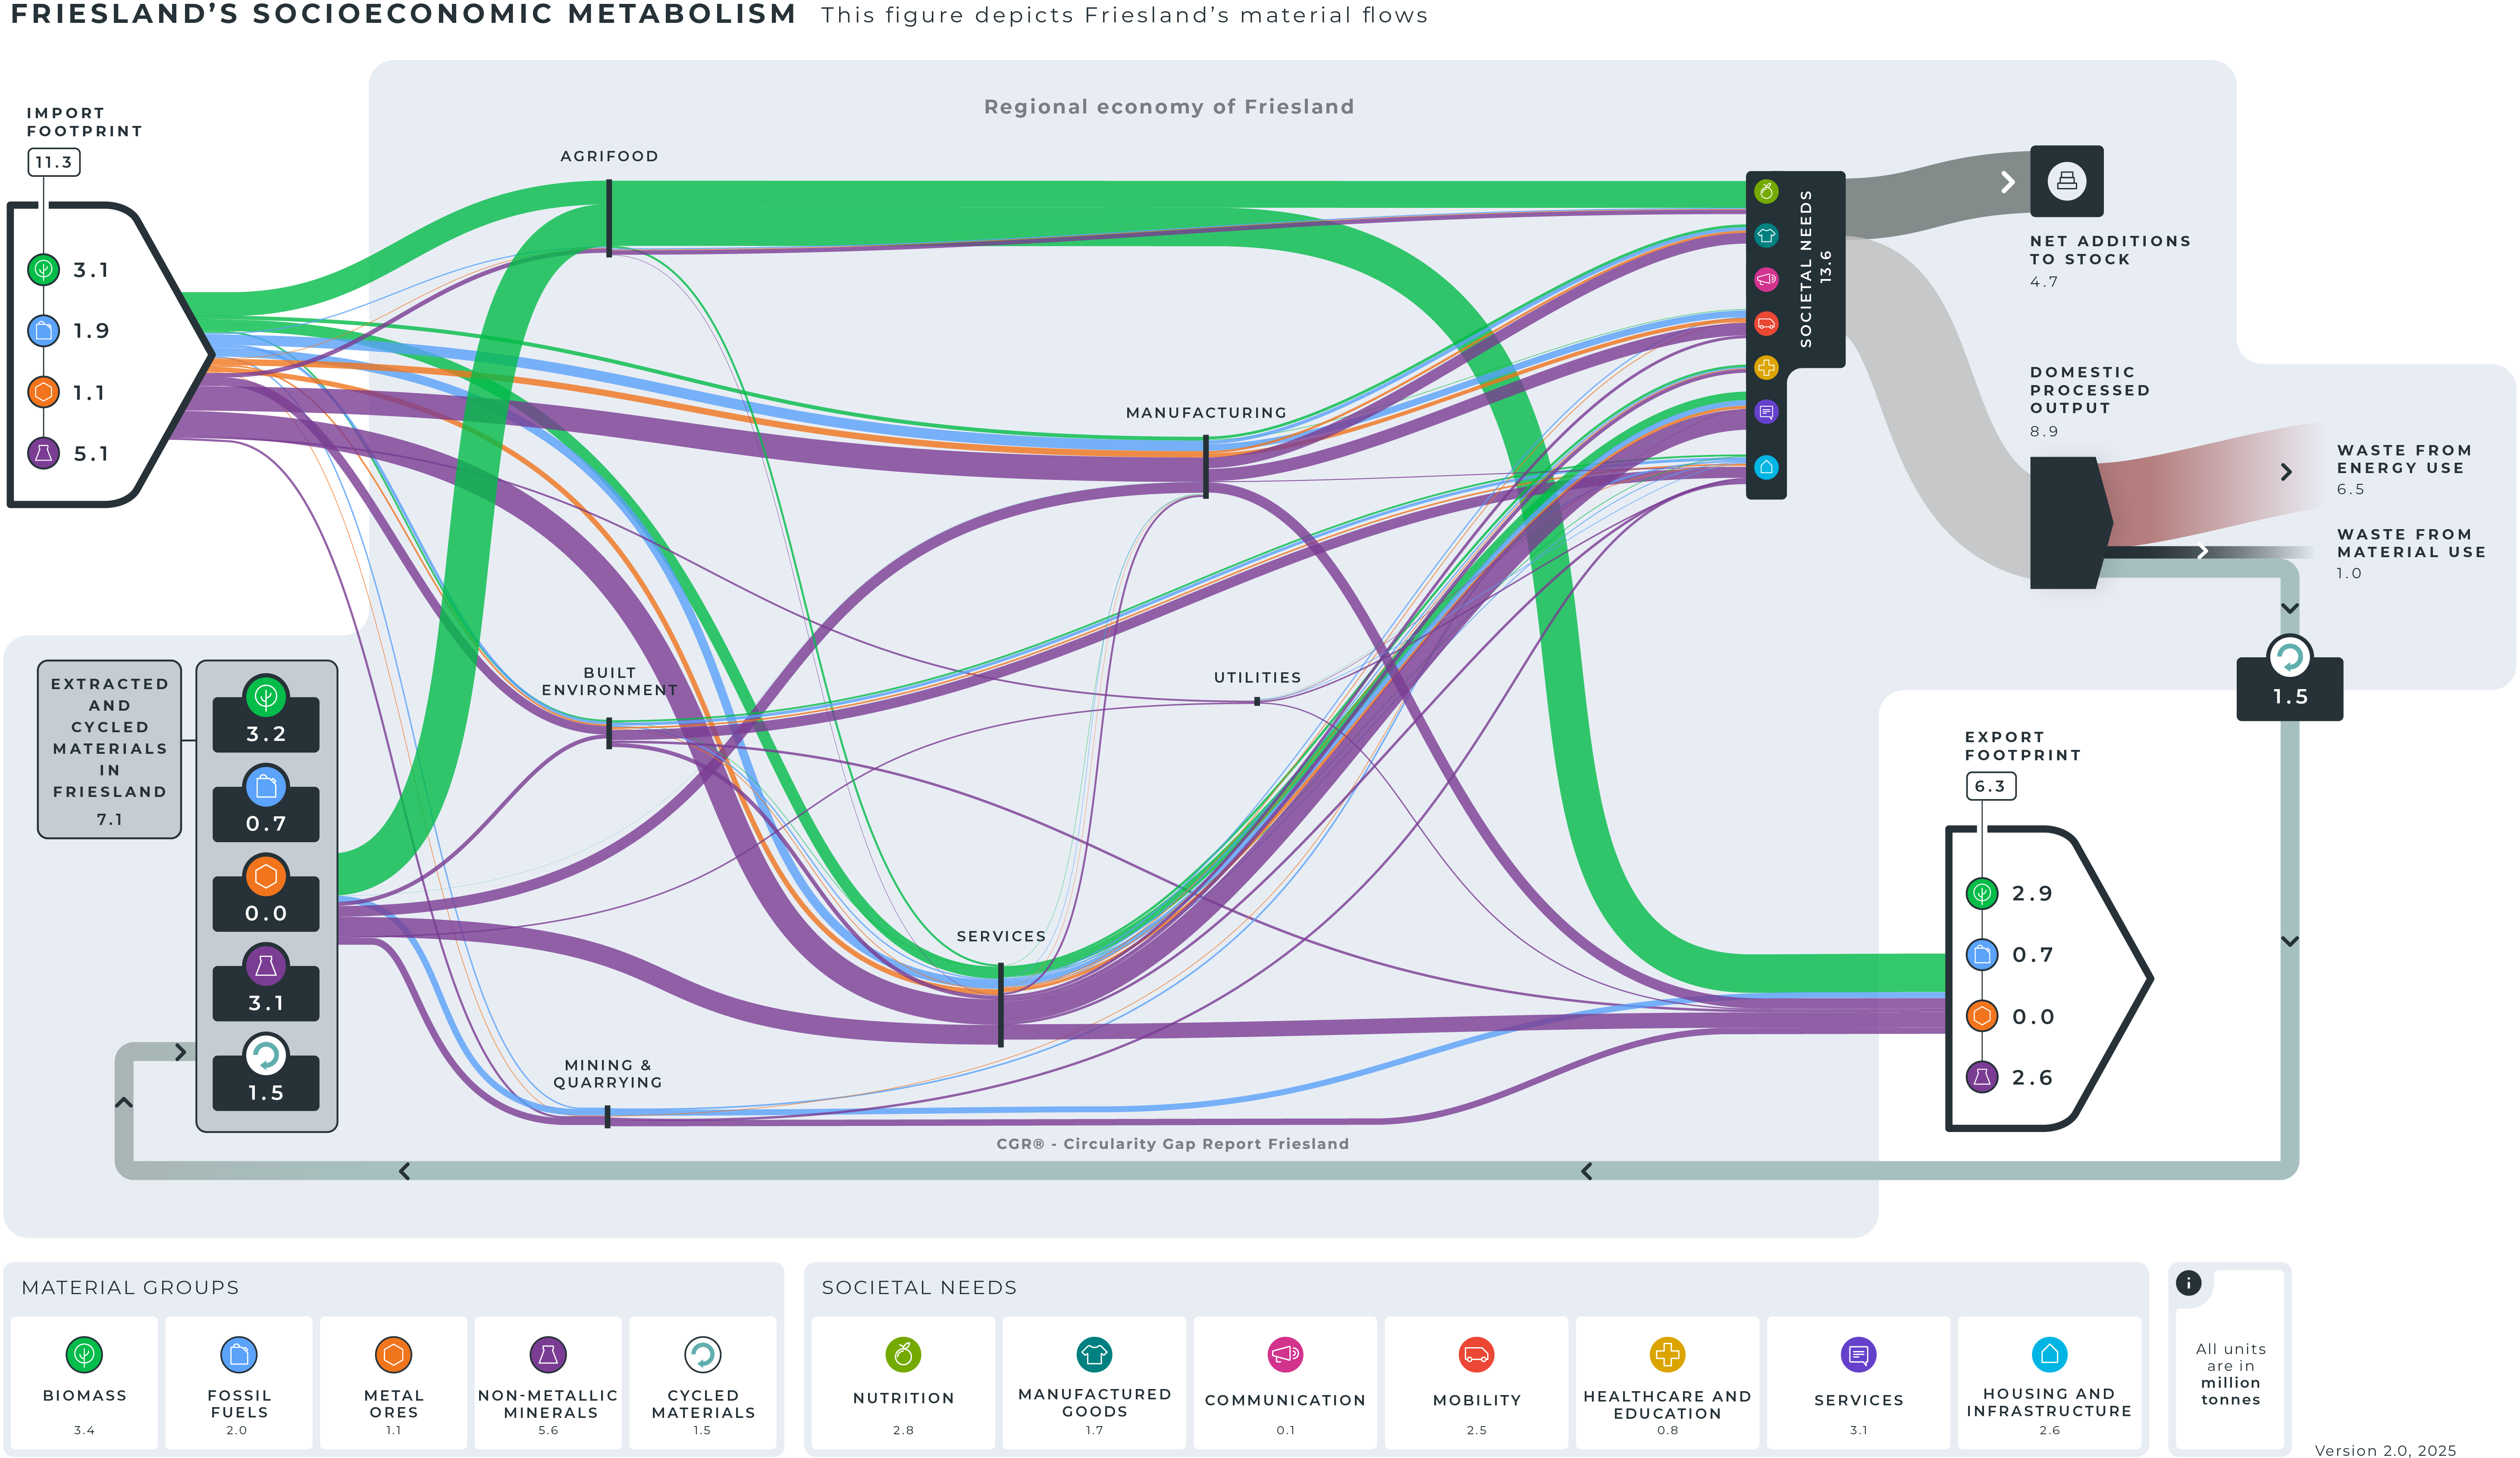

The Sankey diagram tracks all materials—both virgin and secondary—as they move through the economy, showing extraction, imports, processing, and final consumption. In contrast, the material footprint, also known as Raw Material Consumption (RMC), focuses only on virgin materials extracted to support Friesland’s societal needs. It measures the total amount of raw materials required worldwide to produce the goods and services consumed in the region
- Biomass – natural materials like crops, wood, and animal products.
- Fossil fuels – resources such as oil, coal, and natural gas used for energy and manufacturing.
- Metal ores – raw materials like iron, copper, and aluminum used in construction, electronics, and transportation.
- Non-metallic minerals – materials like sand, gravel, and limestone, essential for buildings and infrastructure.
Friesland’s material footprint totals 12 million tonnes annually, or 19 tonnes per capita. This is slightly higher than the national average for the Netherlands, which stands at 17 tonnes per capita. In comparison to Europe, Friesland’s material footprint is below the regional average of 22 tonnes per capita. On a global scale, Friesland’s footprint is higher than the world average of 12 tonnes per capita.
Friesland’s material footprint is broken down into four key material groups. The largest share, 46% of the total footprint, comes from non-metallic minerals (5.6 Mt), with sand and gravel making up the majority of this category. Biomass follows at 28% (3.4 Mt), with the largest share of this coming from grazing, straw, and feed. Fossil fuels account for 16% (2.0 Mt), while metal ores make up the smallest share at 9% (1.1 Mt). The significant contributions from non-metallic minerals and biomass reflect Friesland’s strong agricultural sector and highlight the extensive use of materials in infrastructure and construction.
The most material-intensive sector in Friesland is ‘Other Services’ (including public administration and defence, business services, computer programming, and wholesale trade as the most materially intensive sectors), with the largest material group being non-metallic minerals. This sector’s material footprint totals around 2.8 Mt. It is followed by Nutrition with 2.5 Mt, Shelter with 2.3 Mt, Mobility with 2.2 Mt, and Manufactured Goods with 1.5 Mt. Healthcare and Education follow with a footprint of 0.7 Mt, with Communication contributing the least to Friesland’s overall material footprint at 0.1 Mt.
The material footprint by country of origin highlights the spatial distribution of environmental impacts, showing where resource extraction, production, and emissions occur. In Friesland’s case, the largest share of its material footprint—8.3 Mt—originates outside Europe. The second-largest portion, 2.6 Mt, comes from the rest of Europe beyond the Netherlands. Meanwhile, Friesland itself accounts for 0.8 Mt, and the rest of the Netherlands contributes 0.4 Mt. This demonstrates that Friesland’s virgin material consumption is largely reliant on international supply chains, with the majority of resource extraction and production occurring beyond its borders.
Total material extraction in Friesland reaches 7.1 Mt, with the majority consisting of biomass (46%), non-metallic minerals (44%), and fossil fuels (10%). Of the materials extracted, the largest share—3 Mt—is exported to other European countries, while 1.9 Mt are sent beyond Europe. An additional 1.3 Mt is directed to the rest of the Netherlands, and 0.8 Mt remain within Friesland. This distribution shows that while over 60% of Friesland’s extracted materials are used regionally or nationally, a significant portion is also exported globally.
While Friesland’s material footprint is largely shaped by international resource extraction, its extraction profile is more regionally focused, highlighting a structural imbalance between imported and exported materials.
Improving material flows and footprints
Friesland is home to many initiatives that already contribute to reducing its material footprint—a key pillar of the circular economy and essential for meeting national goals.
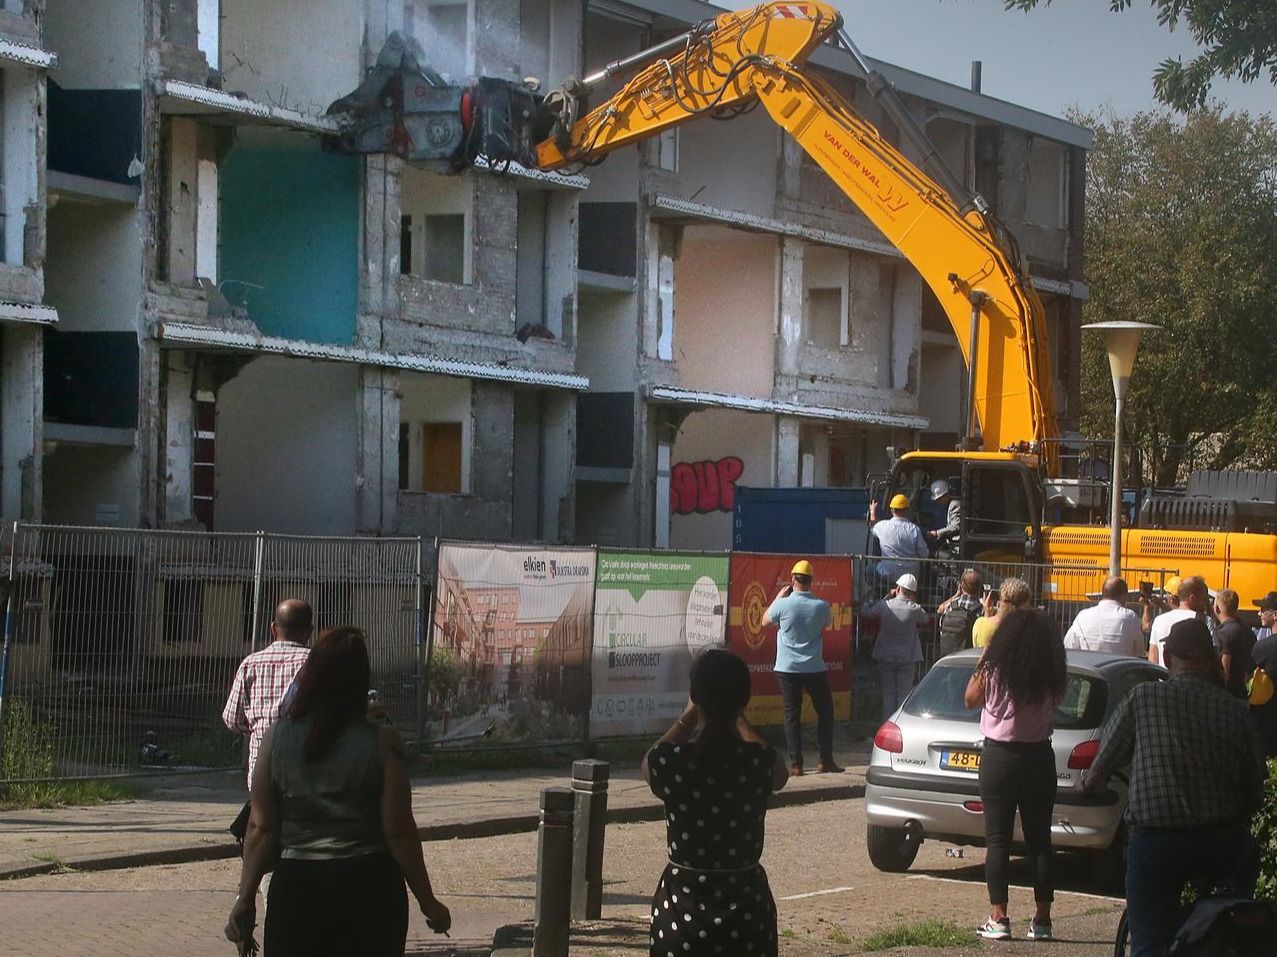
The first circular concrete chain in Heechterp, Leeuwarden
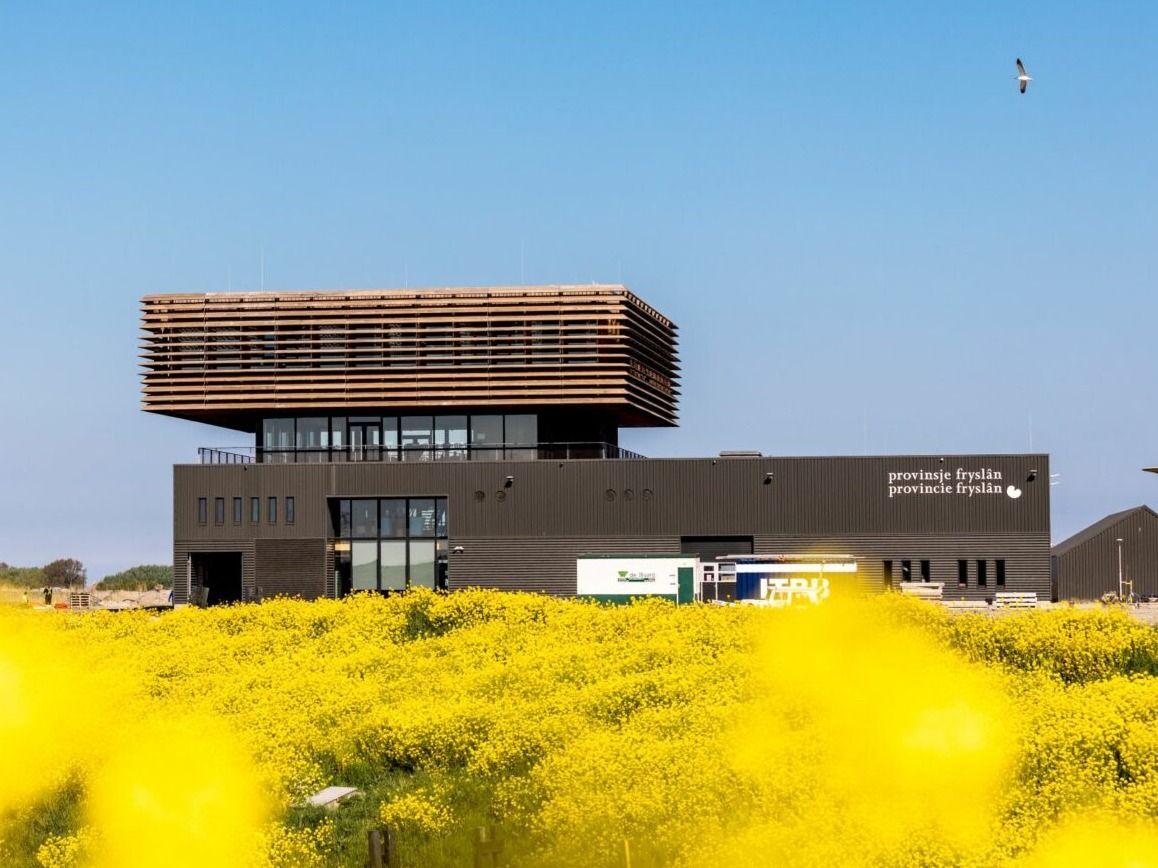
It Swettehûs: Circular Innovation in Infrastructure
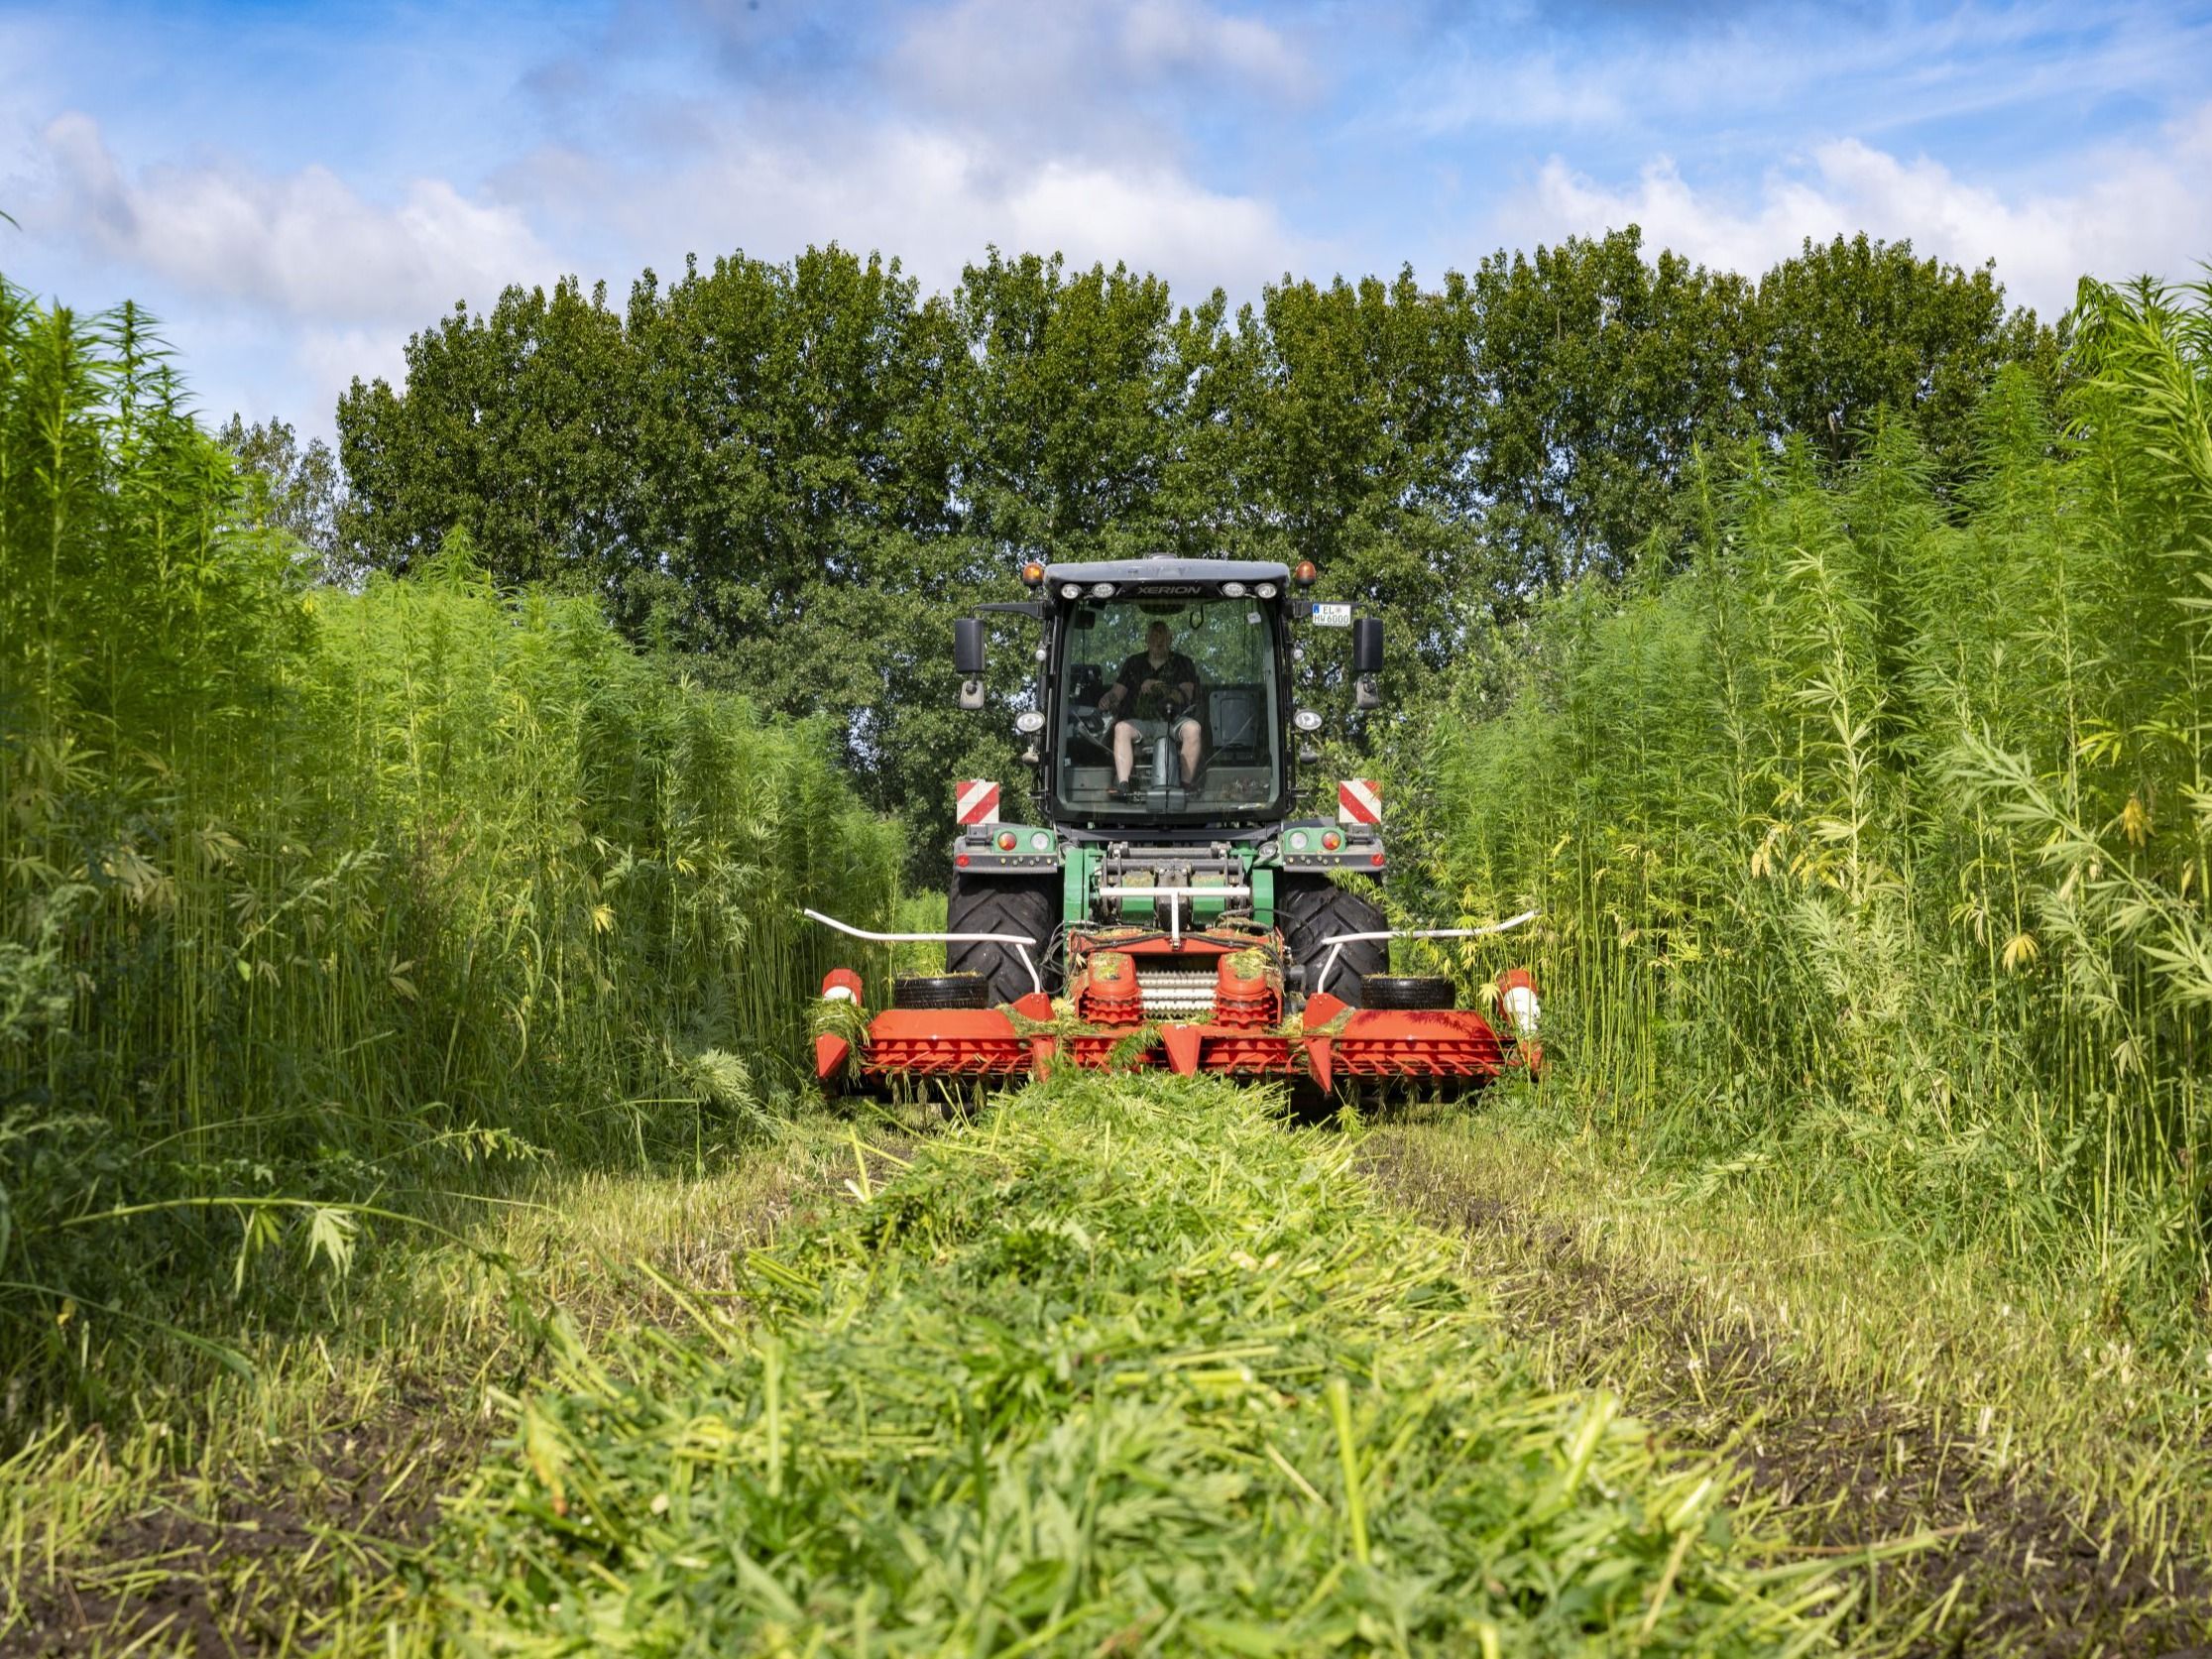
Friesland Builds Biobased: The Fibre Hemp Deal
On the way to green asphalt in the Northern Netherlands
To strengthen this impact, the region can focus on measures, such as:
- Shortening supply chains wherever possible, increasing control over material flows and reducing dependence on external inputs.
- Prioritising higher R-ladder strategies such as reuse, repair, and refurbishment can make a significant difference—many of these actions can be carried out locally, using resources already within the province.
- Scaling up the initiatives already underway will be crucial to accelerating progress.
- Encouraging initiatives to measure their material footprint impact
Metabolic & Urgenda. (2015). Circulair Fryslân: de economie van de toekomst. Retrieved from: Urgenda website